Key Insights:
- Cardano’s bullish trend peaked at $0.4441, its highest point in 90 days, then plummeted to an intra-day low of $0.4274, providing a support level.
- Despite market turbulence, bulls drove a 2.15% price increase to $0.4474, signaling strong demand for ADA.
- Technical indications point to a positive attitude in the ADA market, which might indicate a buying opportunity for traders.
In the last 24 hours, Cardano’s (ADA) bullish trend peaked at $0.4441, its highest point in 90 days, but eventually succumbed to bearish sentiment. Despite attempts to break through the resistance level, the bears regained market dominance and pushed the price down to an intra-day low of $0.4274, which created a support level. Currently, the ADA market is being led by bulls again, resulting in a 2.15% surge in price to $0.4474.
During the market recovery, the market capitalization of ADA rose by 2.13% to $15,556,586,964, whereas the 24-hour trading volume declined by 19.53% to $572,324,053. This indicates that despite market instability, there is still a significant demand for ADA, and investors remain optimistic about its long-term prospects. Nonetheless, the drop in trading volume suggests that some traders may adopt a more careful approach in the short run.
Should the $0.4274 support level be breached, it is vital to monitor the support levels at $0.4200 and $0.4000. Conversely, if a bullish reversal occurs, the resistance levels to watch are at $0.4500 and $0.4700.

ADA/USD 1-day price chart (source: CoinMarketCap)
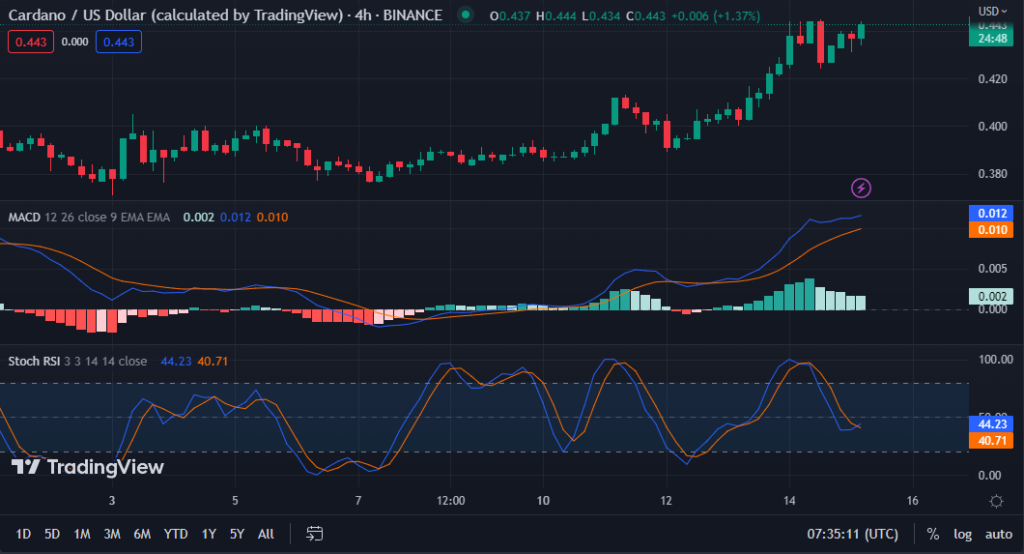
On the 4-hour price chart of ADAUSD, the Moving Average Convergence Divergence (MACD) blue line has a score of 0.012, indicating that it is currently positioned above its signal line. This upward motion suggests that the Bulls’ recent recovery of the ADA market is gaining momentum, potentially resulting in a brief but favorable trend reversal.
An optimistic histogram suggests that there might be an upsurge in buying activity. If the bulls surpass the resistance level, it could stimulate more buying and drive the price higher.
With a reading of 44.23, the stochastic RSI has moved above its signal line, signaling the formation of bullish momentum and increasing the likelihood of a breakout over the resistance level. Traders may view this surge in stochastic RSI movements as a chance to enter the market at a lower price point before the breakout occurs, potentially presenting a buying opportunity.

ADA/USD 4-hour price chart (source: TradingView)
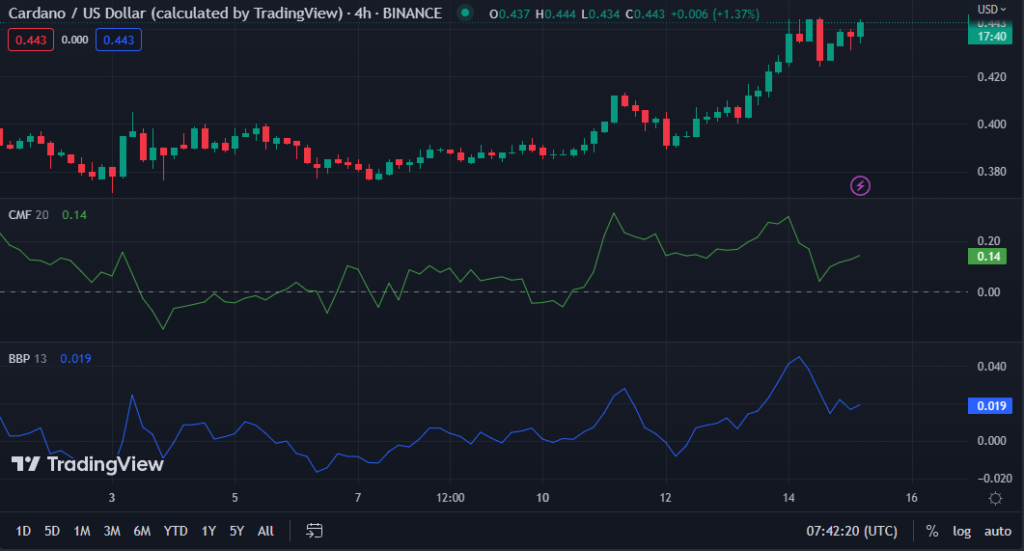
With a positive value of 0.14, the Chaikin Money Flow indicator suggests an increase in buying activity in the market and supports the upward trend of ADA. This movement indicates that investors are optimistic about the potential of ADA and are willing to pay a higher price for it, indicating a bullish sentiment in the market.
Traders may contemplate adopting bullish positions on ADA to benefit from this present trend.
The Bull Bear Power score of 0.0019 suggests a rise in buying pressure, which could imply a favorable time to buy ADA. A continued increase in BBP may signify a bullish market trend, and ADA holders may want to contemplate holding onto their coins for an extended period.

ADA/USD 4-hour price chart (source: TradingView)
Conclusion
To summarize, the recent rebound of ADA from the bearish pressure indicates a hopeful indication of a short-term upswing, and investors seem confident about its long-term prospects.


