


Key Insights:
BTC breaks resistance at $28,159.86 and eyes $30,000.
Indecisive market indicated by Keltner Channel bands contraction.

Bullish trend supported by 100-day moving average crossing over 20-day moving average.
Although Bitcoin (BTC) started the day under negative emotion and therefore dropped in price to a 24-hour low of $27,872.15, bulls regained control. With enough upward pressure, prices reached $28,159.86 before hitting the ceiling. Despite this hurdle, BTC was trading at $28,030.30, up 0.30 percent from its previous value at the time of writing.
If the bullish trend continues and $28,159.86 is overcome, the next resistance level might be near $30,000, a critical psychological barrier for long-term investors and short-term traders. However, if the resistance level holds, we may see a temporary pullback in BTC’s value before another attempt to break through.
BTC’s market capitalization soared by 0.36% to $542,201,052,689, while the 24-hour trading volume dipped by 19.63% to $9,226,160,956. This contrast reflects the stability of BTC’s overall value despite a decrease in trading activity, indicating a strong hold on the market by BTC investors. This action indicates that Bitcoin investors have a long-term investment plan and are not readily persuaded by short-term market volatility, which recounts well for the cryptocurrency’s future.
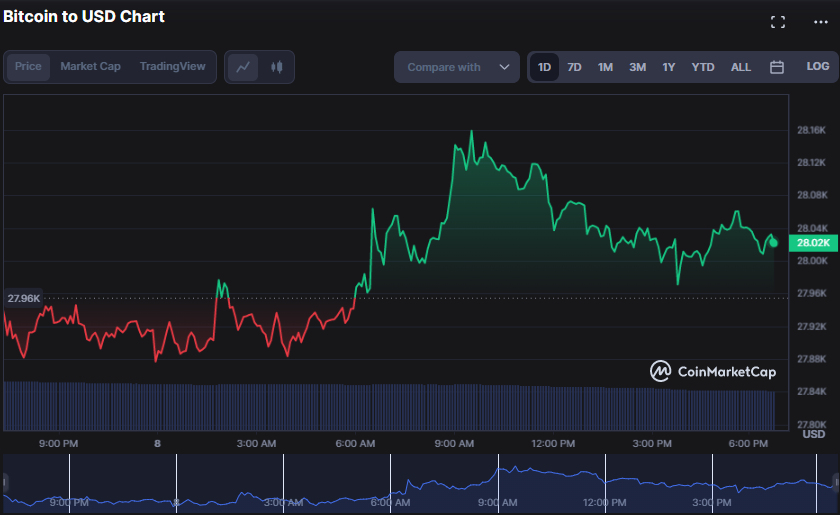
BTC/USD 1-day price chart (source: CoinMarketCap)
On the 4-hour price chart, the Keltner Channel bands are contracting, with the upper bar at $28507.8 and the lower bar at $27712..88, indicating the possibility of a breakout in either direction as the price gets more compressed within the tighter range.
The price action’s movement below the signal line indicates that the market is presently indecisive, and traders should wait for clear confirmation of a trend before making any substantial transactions.
Since the MACD blue line has gone below the signal line and into the negative territory, with a value of -50.54, the bullish momentum apparent in the BTC market may be fading, and traders should take care before establishing any long positions. The histogram has also gone negative, signaling a likely downturn in the near future, adding to the bearish momentum forecast.
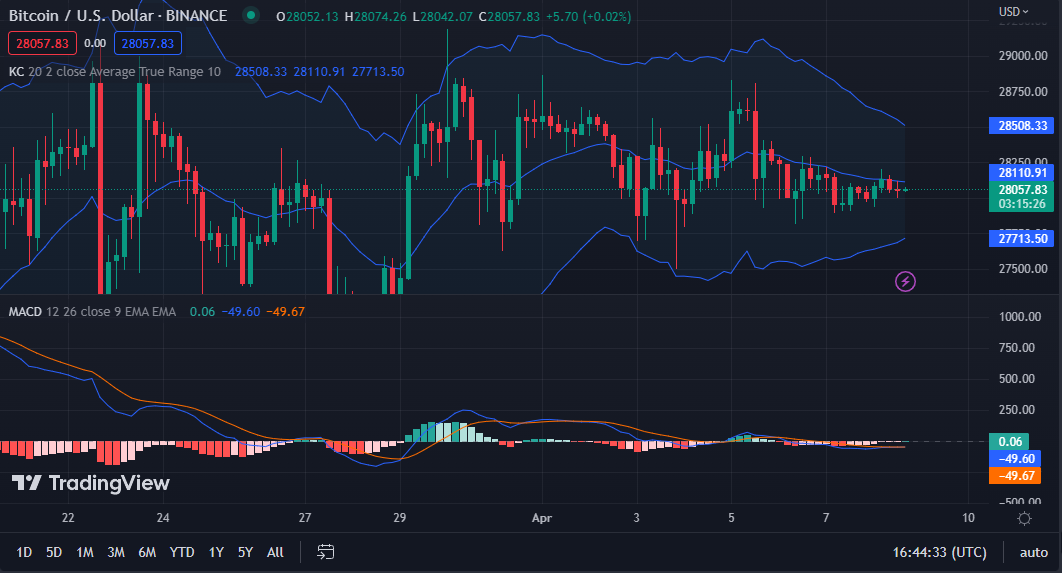
BTC/USD 4-hour price chart (source: TradingView)
Since the 100-day moving average has passed over the 20-day moving average, with the latter reading at $28060.10 and the former at $28118.46. This movement indicates that BTC is in a bullish trend, implying that the cryptocurrency’s price will likely rise in the near future.
Price movement below both moving averages indicates that traders are now purchasing BTC at a greater pace than they are selling, which might lead to more price gains. However, it is crucial to remember that cryptocurrency markets may be volatile and unexpected, so investors should always proceed with care.
The bullish momentum in BTCUSD is now strong, with a Chaikin Money Flow rating of 0.05 and rising northward. Still, investors should be aware of the dangers involved and consider diversifying their portfolios to limit losses.
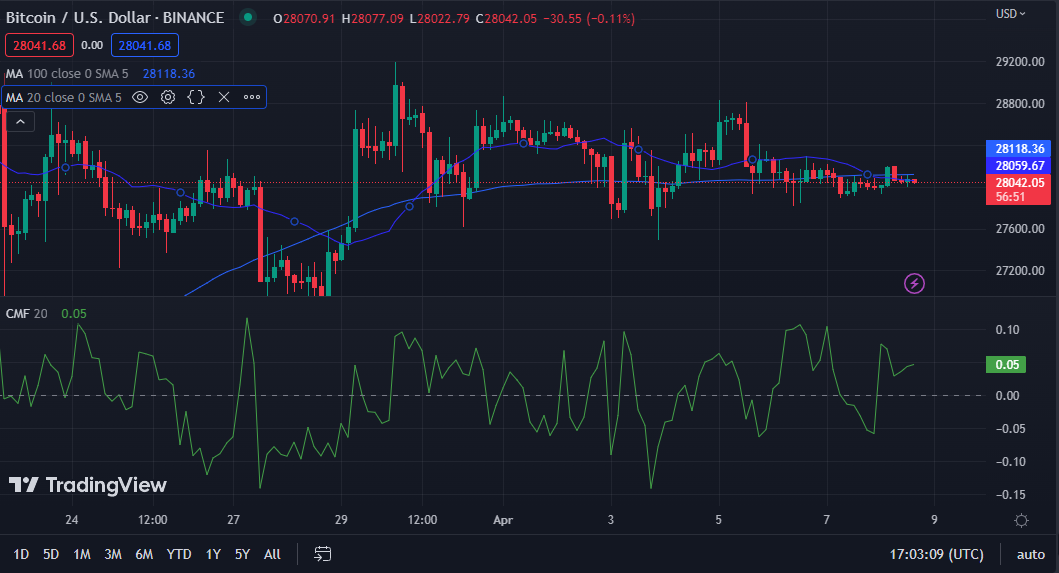
BTC/USD 3-hour price chart (source: TradingView)
In conclusion, Bitcoin’s bullish momentum remains strong despite market indecision and potential resistance at $30k. Traders should proceed with caution and diversify portfolios to mitigate risks.


